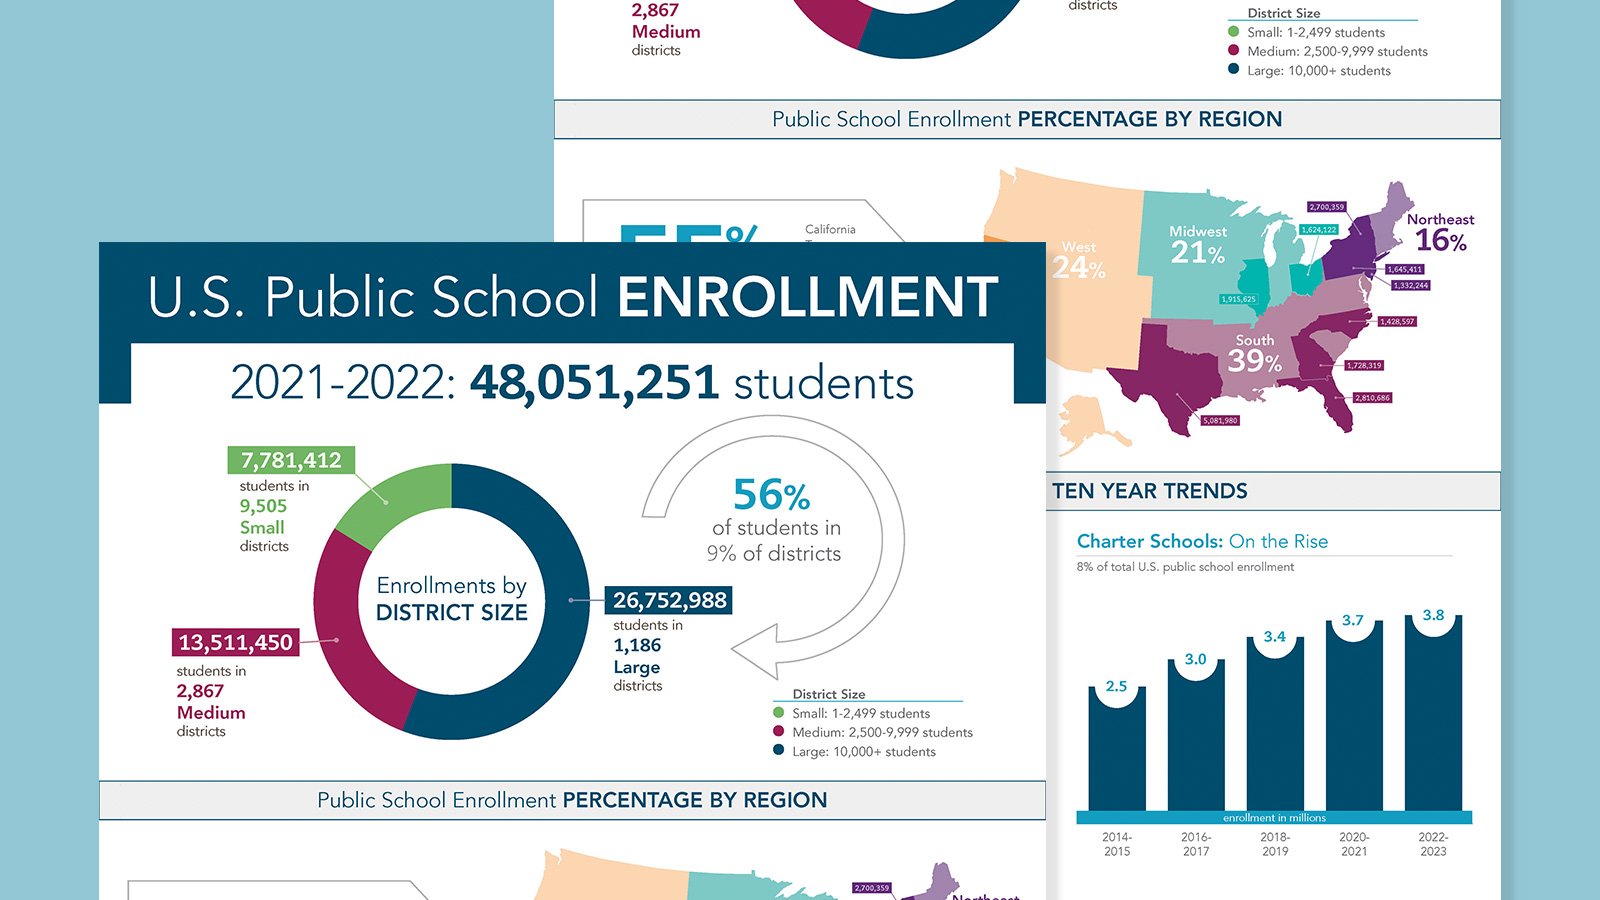
By The Numbers: U.S. Public School Enrollment

What does enrollment look like in U.S. public schools?

Our public school enrollment infographic offers a snapshot of data by district size, region, and ten year trends. Get answers to these questions, and more:

  • Which 10 states enroll the majority of students?
  • How many students are enrolled in the largest districts?
  • How does Charter School enrollment compare?

Students representing public school enrollment

This information can help you know which states and districts represent the best opportunities for your products and services.

Get all the enrollment stats by providing a little information below. 

By clicking the button above, you agree to our Terms of Use and consent to our contact process. See our Privacy Notice to unsubscribe.

You consent to Dun & Bradstreet, (D&B) using this data for marketing and analytical purposes, and to D&B emailing you or using an autodialer or pre-recorded voice to text or call you at the number you provide with marketing or other offers. Consent is not a requirement of purchase.