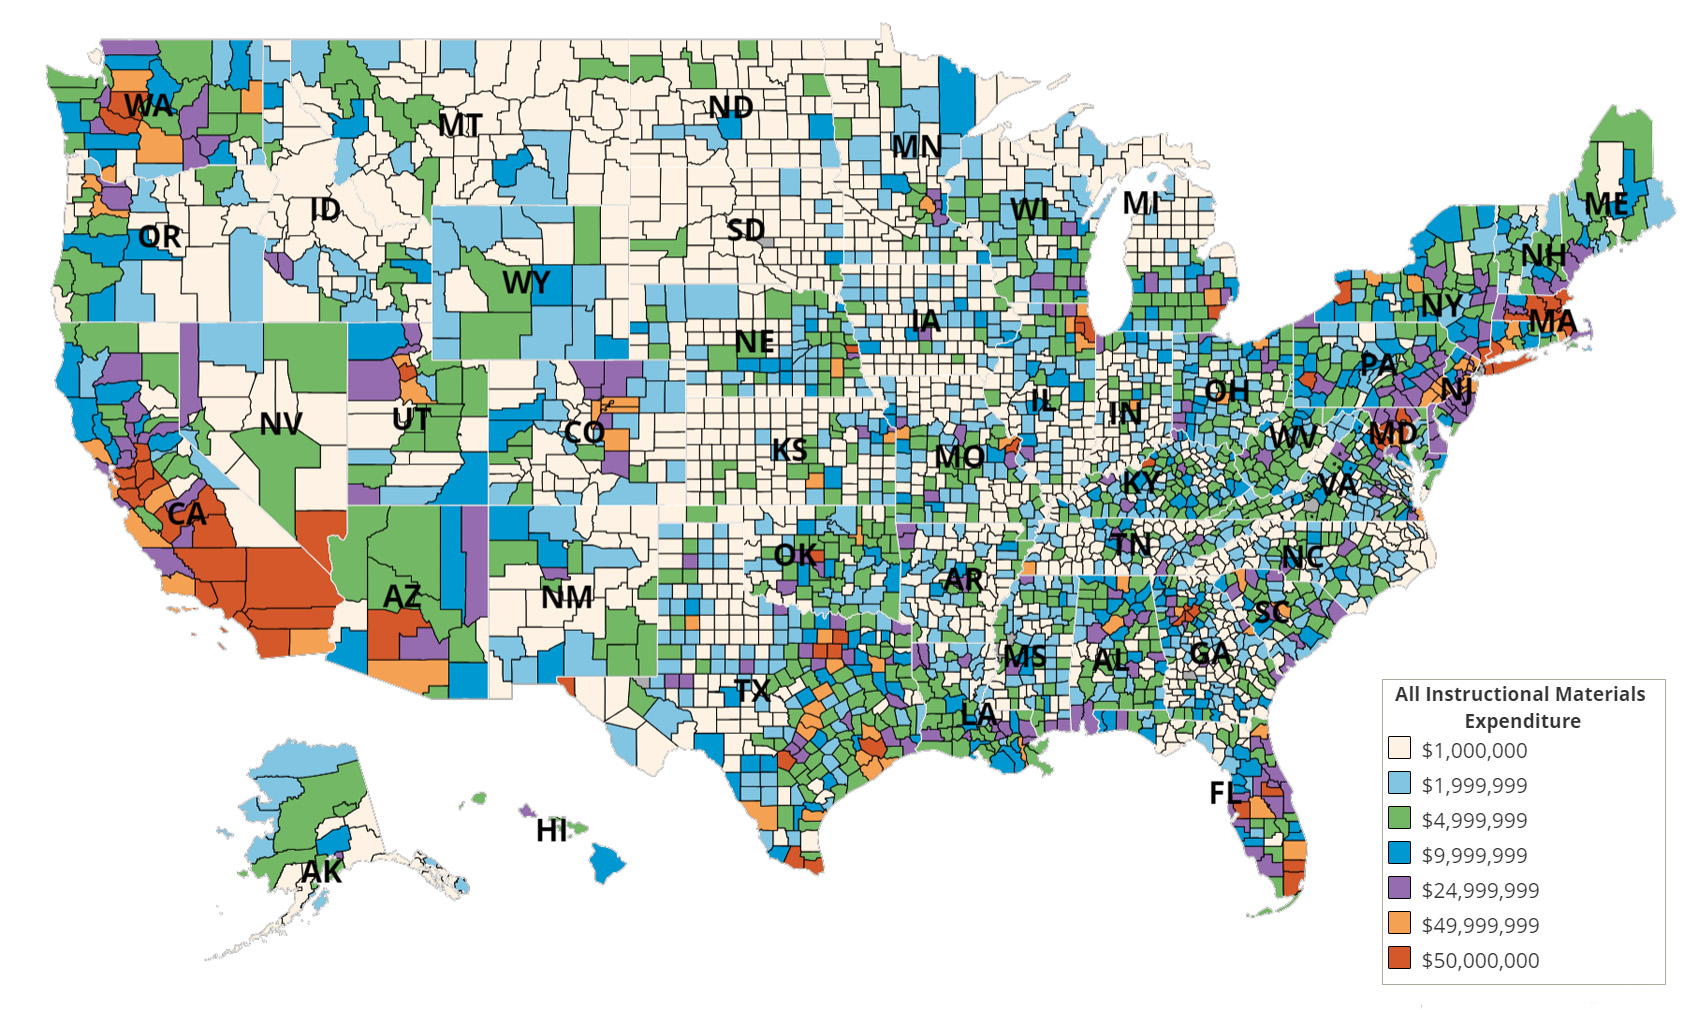
A visual tool to help you see your best areas of opportunity
Click on the map below to get started. When you hover over an individual county you will see how the county ranks in the state based on AIM expenditure and the total AIM allocated to it. The statistics for each state include total enrollment, number of districts and schools, along with Title I allocation, total state AIM expenditure, ESSER II, and ESSER III allocations.

The $100+ Million Counties
- NEW YORK, NY: $ 921,438,457.00
- LOS ANGELES, CA: $ 727,198,567.00
- HARRIS, TX: $ 317,948,383.00
- COOK, IL: $ 272,067,576.00
- RIVERSIDE, CA: $ 202,656,632.00
- ORANGE, CA: $ 197,790,401.00
- SAN BERNARDINO, CA: $ 196,174,101.00
- DALLAS, TX: $ 187,355,796.00
- MARICOPA, AZ: $ 169,485,766.00
- TARRANT, TX: $ 162,626,824.00
- SAN DIEGO, CA: $ 158,936,813.00
- BEXAR, TX: $ 154,485,283.00
- FRESNO, CA: $ 148,285,064.00
- MIDDLESEX, MA: $ 138,562,500.00
- HIDALGO, TX: $ 130,108,248.00
- MIAMI-DADE, FL: $ 127,156,481.00
- KERN, CA: $ 124,404,392.00
- KING, WA: $ 117,367,284.00
- MONTGOMERY, MD: $ 114,346,002.00
- SACRAMENTO, CA: $ 109,857,473.00