A County-by-County Guide to Instructional Spending
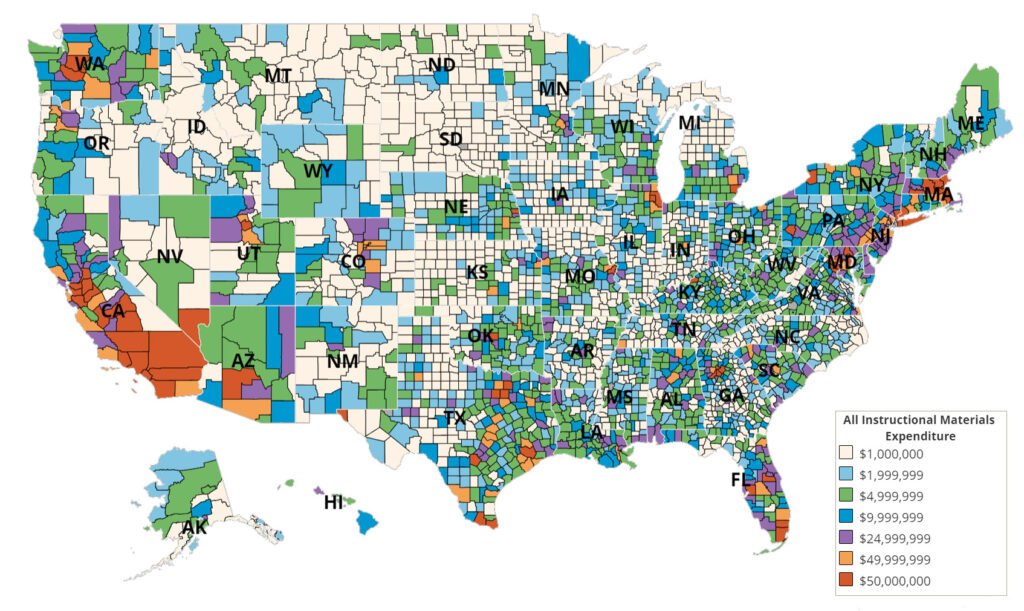
MDR has developed an exclusive measure, All Instructional Materials (AIM) Expenditure, that details public school buying power (AKA how much public schools spend on supplies and materials used for instructional purposes). With that data at hand, this interactive map is a visual tool for viewing this expenditure across the country.
Here’s a sneak preview of some of our findings:
- We place total U.S. public school AIM Expenditures most recently at $18.9 billion
- With information gathered directly from state departments of education about each public school district in the U.S., we’ve mapped spending for all instructional materials
- We’ve tracked the lowest spending at less than $1,000,000, to the highest spending at $50,000,000+
Each state is broken down by:
- Number of districts
- Number of schools
- Enrollment
- All Instructional Materials Expenditure
- Title I funding
- ESSER II and III allocations
The Buying Power Map is free to interact with and features state and county level AIM figures.
Get access to the MDR Buying Power Map.
Share your contact information below to start exploring our map.
By clicking the button above, you agree to our Terms of Use and consent to our contact process. See our Privacy Notice to unsubscribe.
You consent to Dun & Bradstreet, (D&B) using this data for marketing and analytical purposes, and to D&B emailing you or using an autodialer or pre-recorded voice to text or call you at the number you provide with marketing or other offers. Consent is not a requirement of purchase.