Market Reports
-

2025 Marketing Trends & Predictions in Education
Looking back at 2024 to inform your 2025 marketing strategies. Marketing trends in education are always in flux. For example, you know that social media remains one of the best channels for reaching prospects, but what kind of content should you prioritize in this year’s strategy? You also know that AI has become a leading…
-
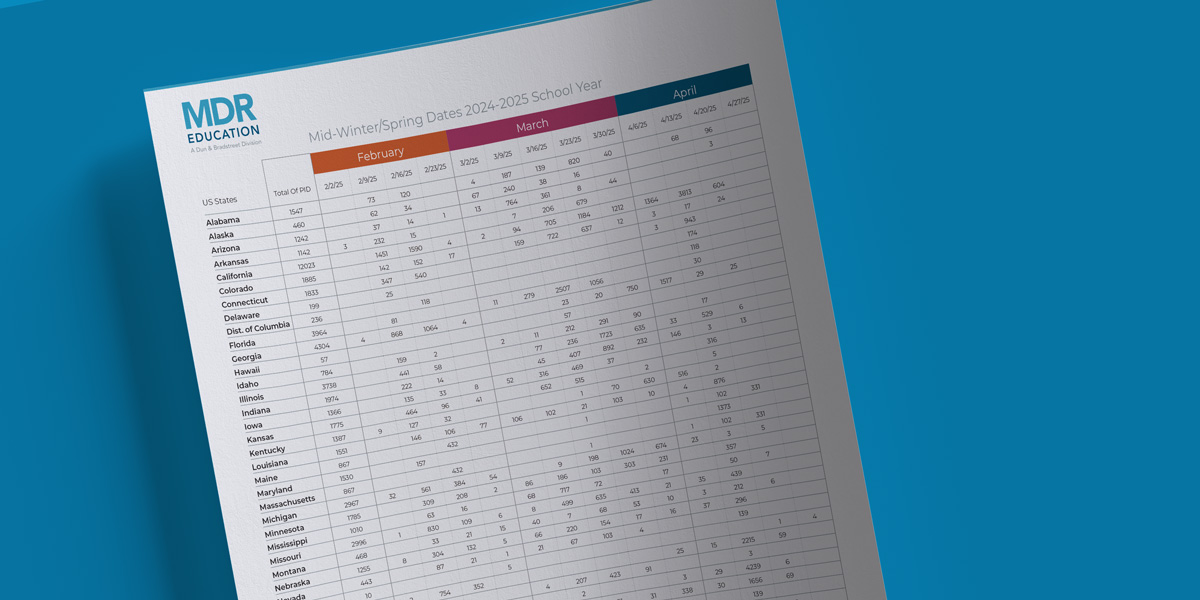
Public School Mid-Winter/Spring Break Dates in the United States
Get our full report on mid-winter/spring break dates—broken down by state—to help you determine the best time to engage your target audience. For the 2024-2025 school year, roughly 27% of schools reported an early break period, with the break beginning between the weeks of February 2, 2025, and February 23, 2025. The majority of schools,…
-
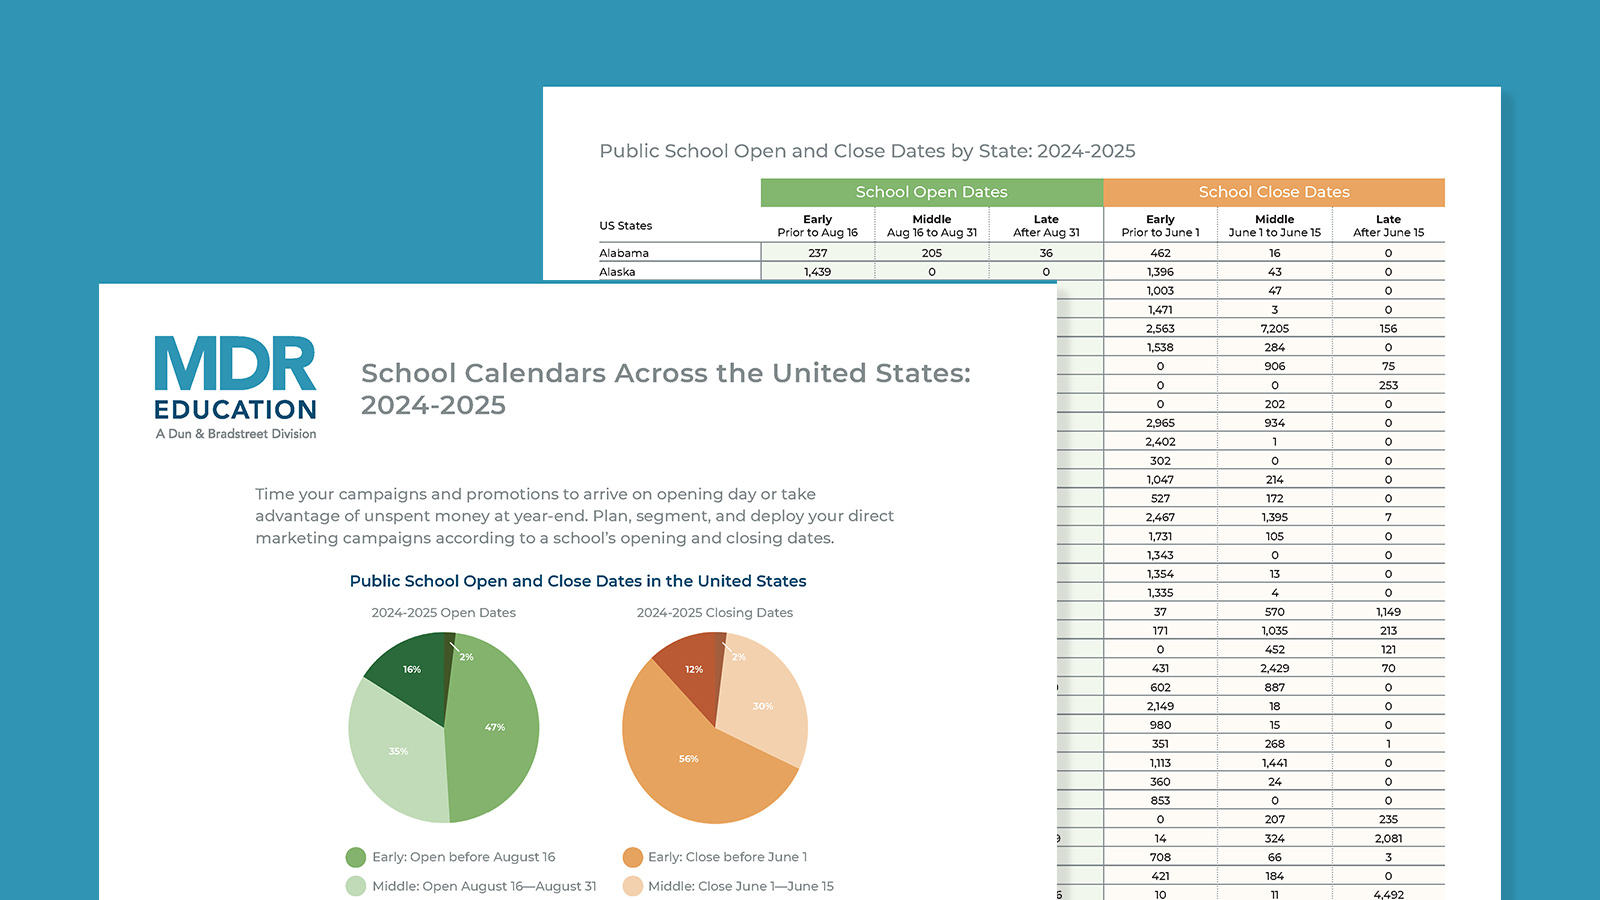
Public School Open and Close Dates in the United States
Not all schools open and close the academic year at the same time! In fact, it can vary quite a bit by region. Use our data on school open and close dates across the country to drive your education marketing decisions and promotions. Be ready to launch at the start of the school year or…
-
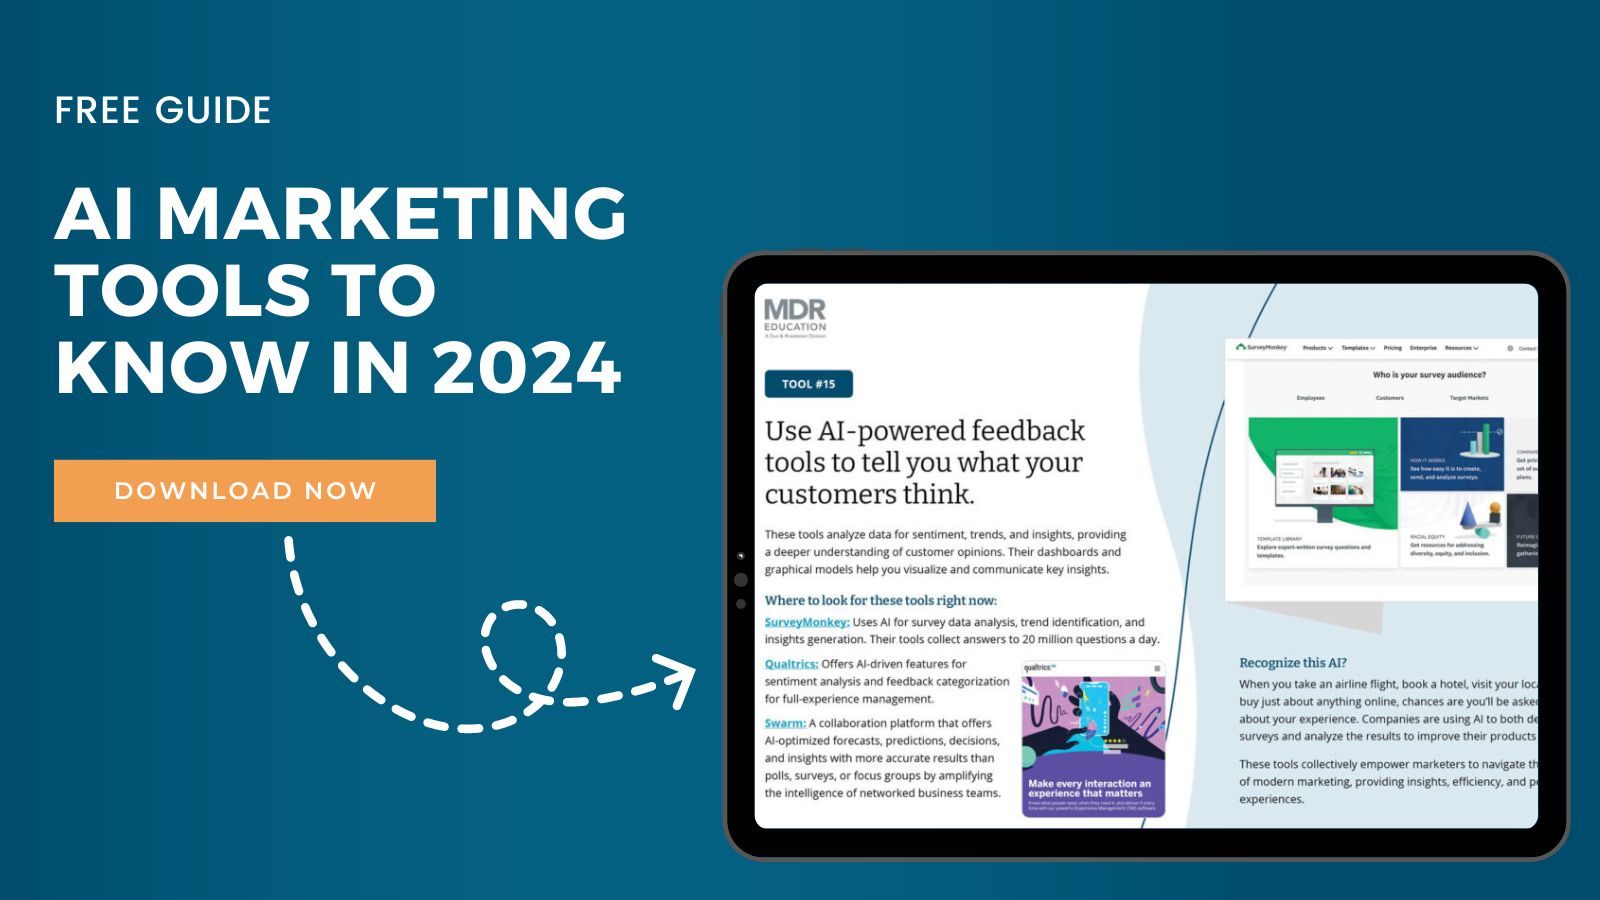
AI Tools to Know in 2024
In this guide, we’ll walk you through 15 AI tools to consider for your marketing efforts. You’ll get a better understanding of how to: Plus, we’ll take a closer look at how big brands like Coca-Cola, Sephora and McDonald’s are using AI to increase sales and customer satisfaction, and how AI tools are helping to…
-
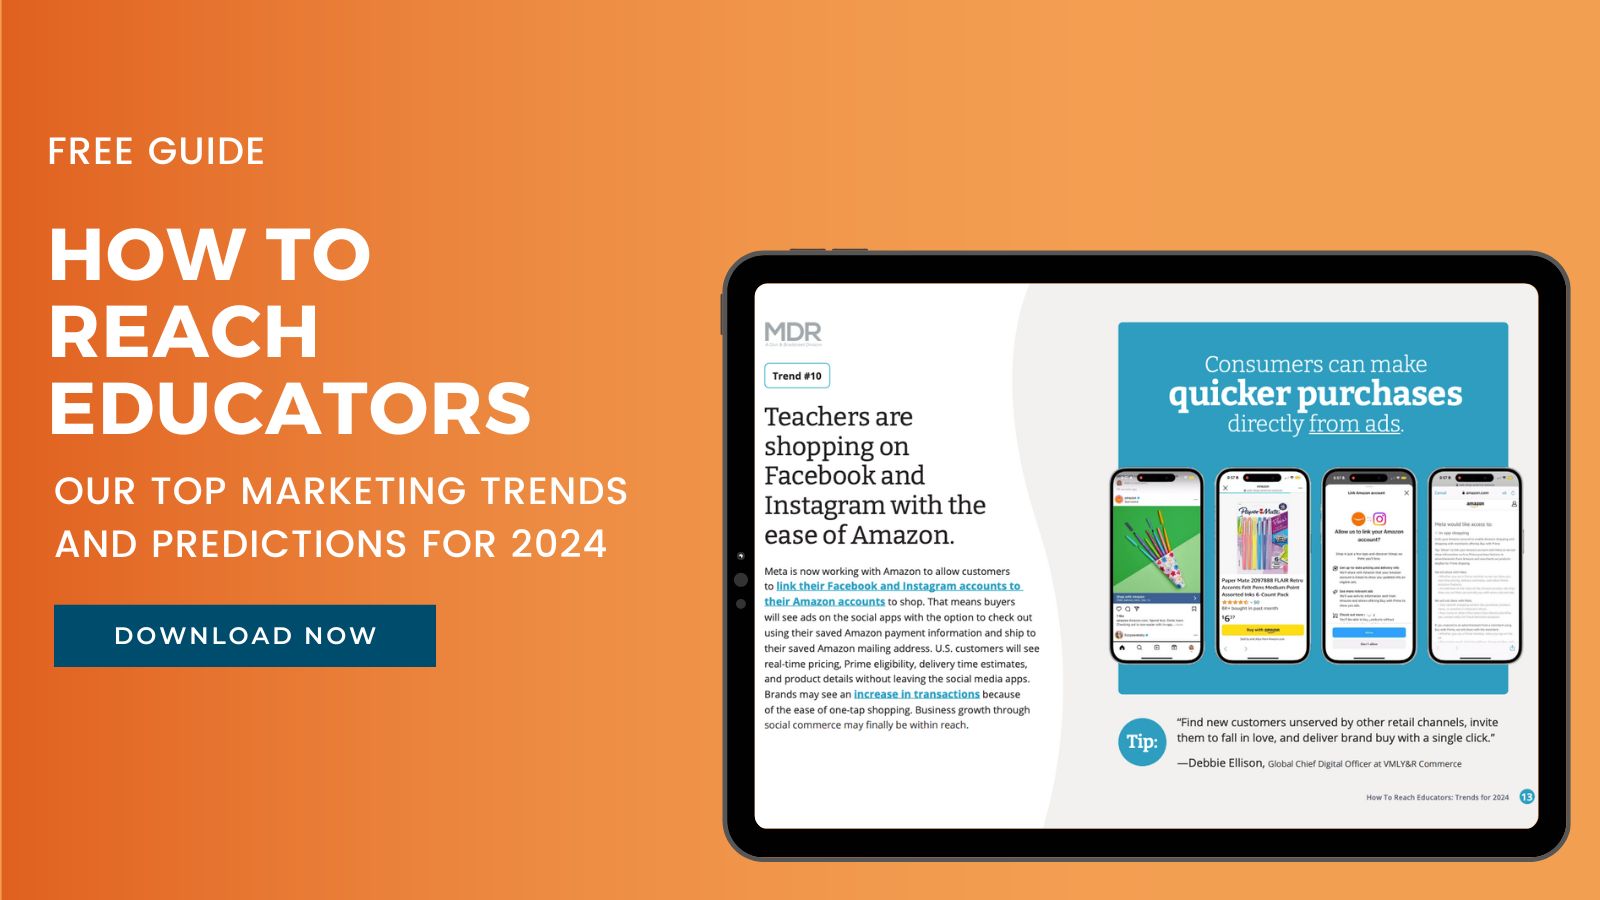
Our Top Marketing Trends and Predictions for 2024
A look back at the marketing landscape in 2023 makes it clear that predicting what’s to come in the year ahead is uncertain business. Who saw the meteoric rise of ChatGPT coming? Who knew Twitter would rebrand as X? In 2024, we are sure to have some surprises, but there are also predictable trends to…
-
Top 25 Most Requested School Supplies for Back-to-School
Fifty million school kids are headed back to school, while families stock up on notebooks, pencils, new clothes, lunchbox snacks, and much, much more. What are the most requested school items across the country? Do any brands reign supreme? Find out with our school supply report. We Are Teachers and MDR analyzed 72,000 school supply…
-

By the Numbers: Financial Literacy in U.S. Schools
How to best teach students financial literacy in schools is a hot topic in education right now. To gain insight into financial literacy in schools, MDR spoke to over 600 teachers and administrators. We asked what financial literacy instruction currently looks like in their districts, which grade levels were receiving this instruction, and what additional…
-
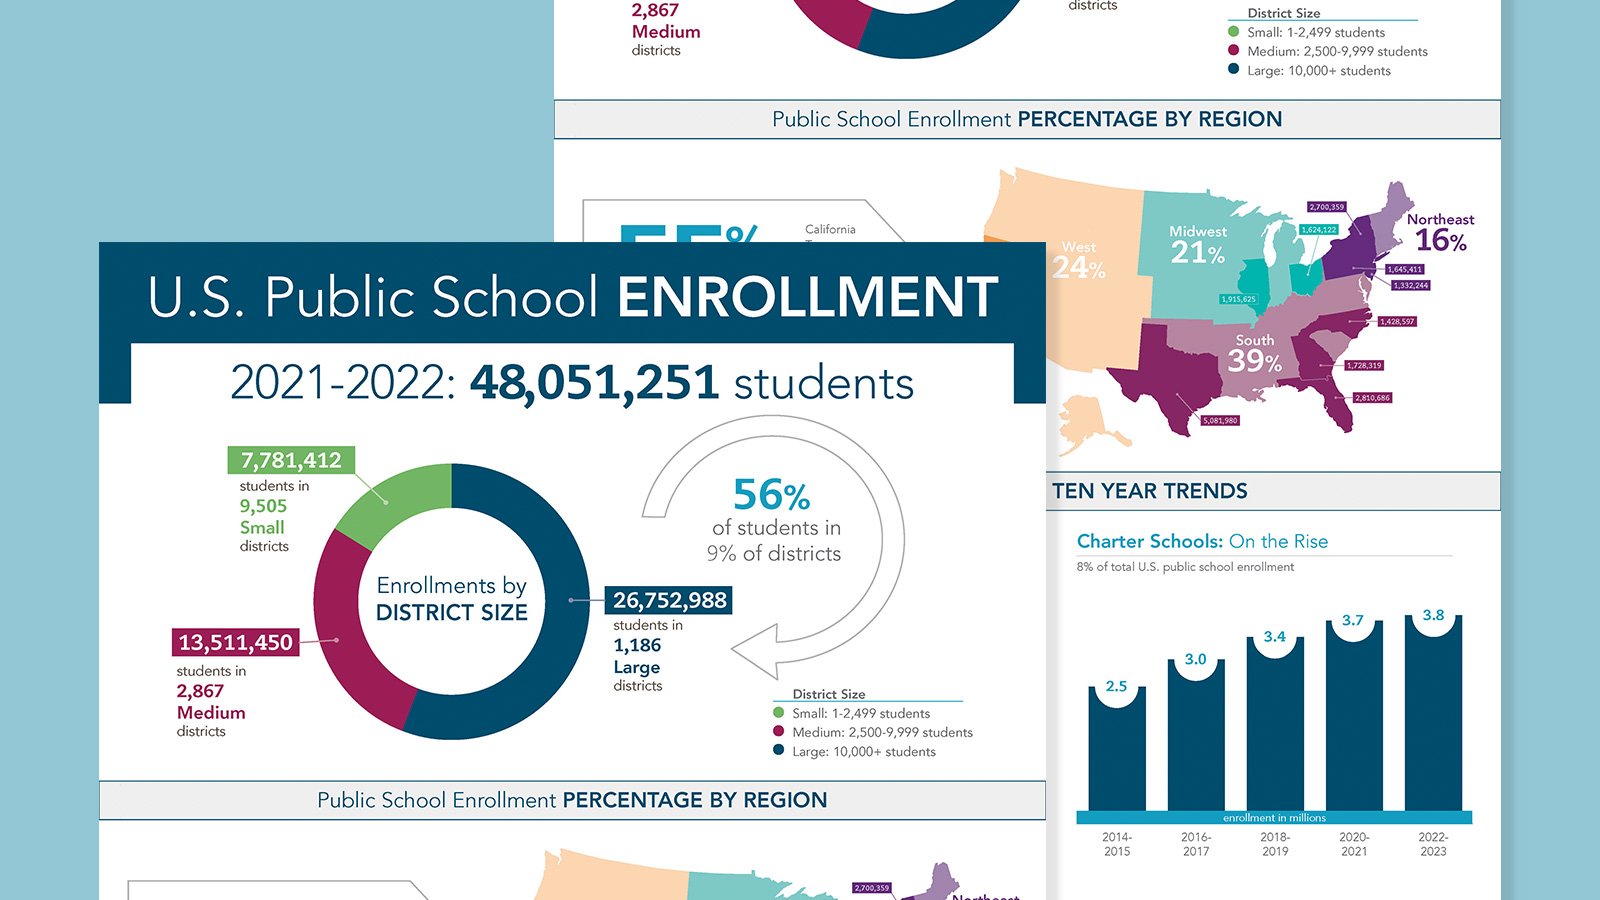
Public School Enrollment: What Does it Look Like Right Now?
This information on public school enrollment can help you know which states and districts represent the best opportunities for your products and services. Our public school enrollment infographic offers a snapshot of data by district size and region, as well as ten-year trends. Get answers to these questions, and more: Come away with important takeaways…
-
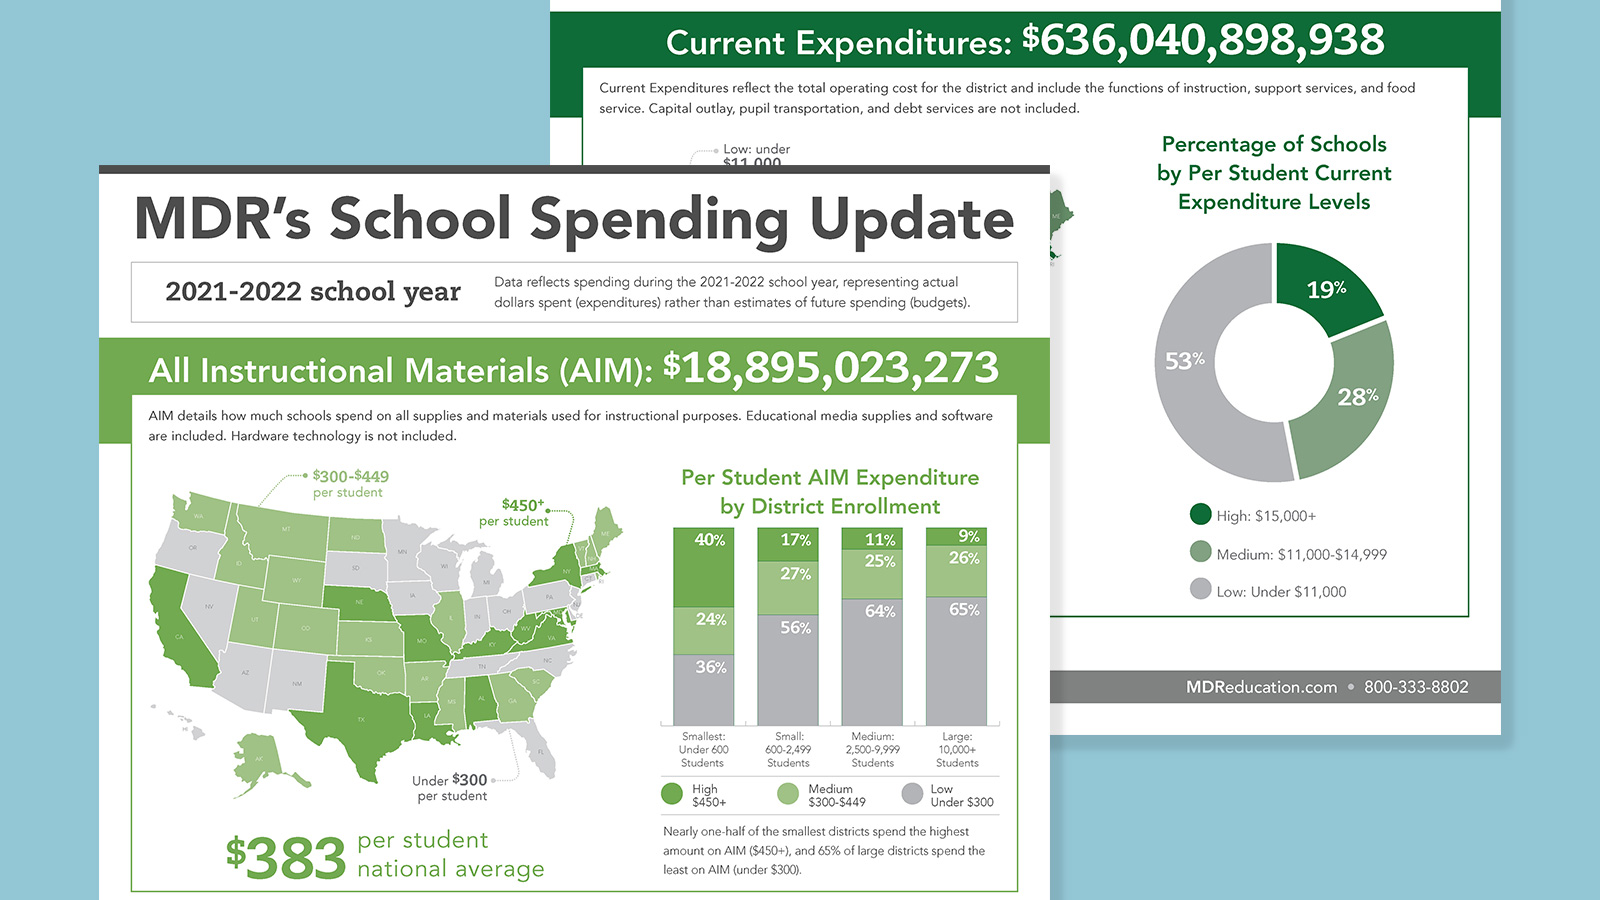
U.S. School Spending Update
Get details on all instructional materials and current expenditure spending in U.S. schools in our school spending infographic. MDR tracks school spending in U.S. K-12 public schools in two categories—All Instructional Materials (AIM) and Current Expenditures. Plus, we’ve got helpful information like which states spend the most per student and a graph of the percentage…
-
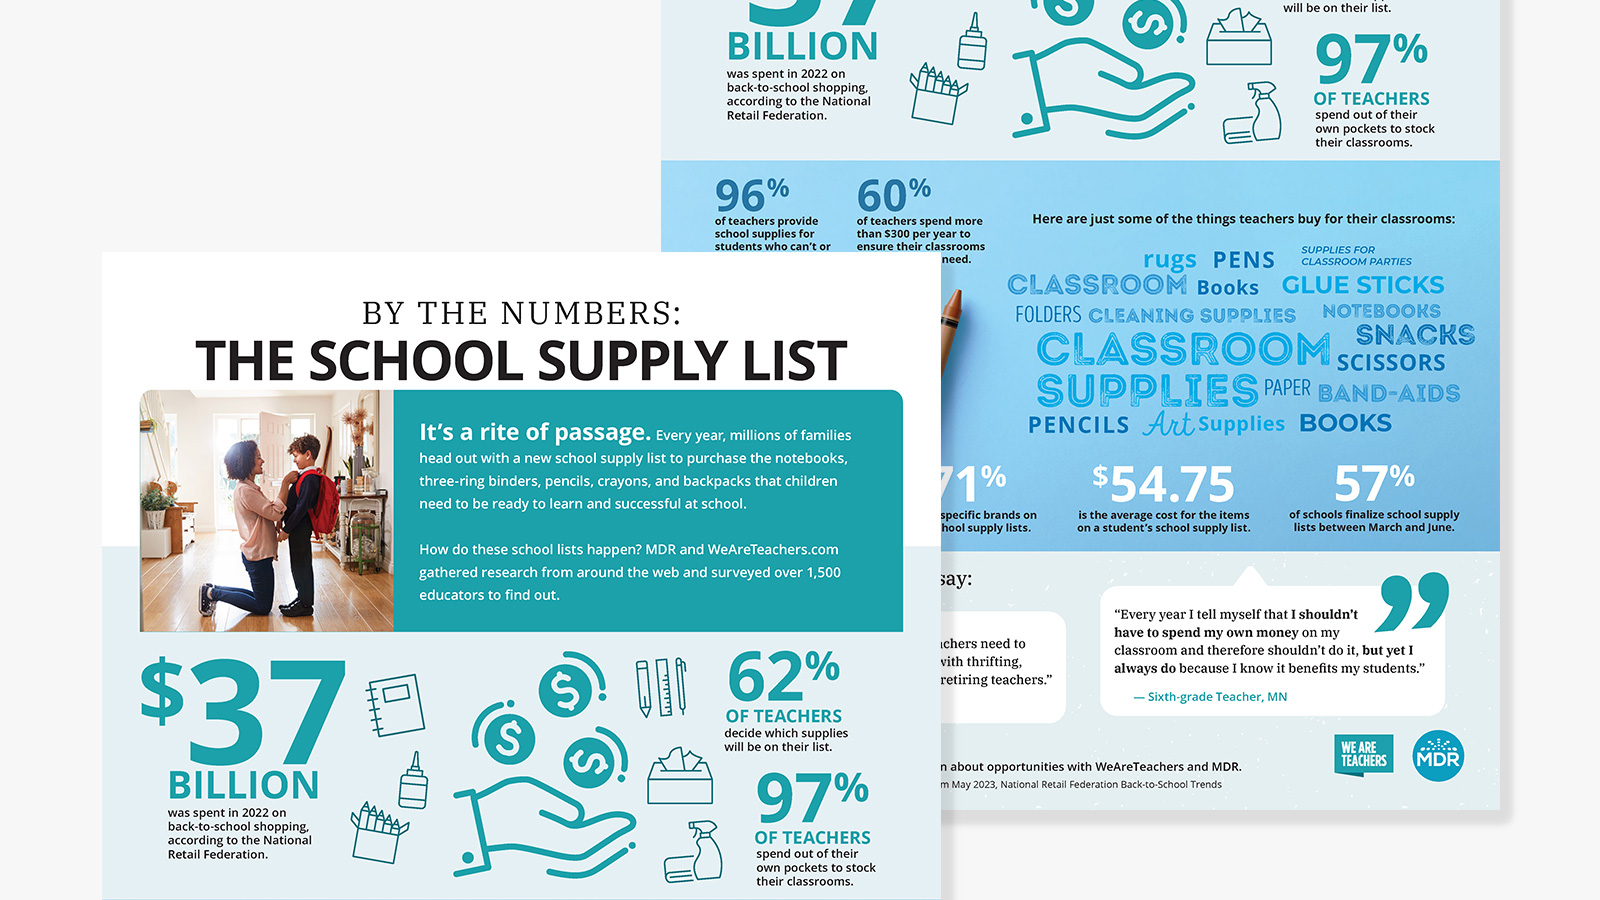
How Do School Supply Lists Get Created?
Download the infographic to get all the school supply lists stats. Every year, millions of families head out with new school supply lists to purchase the notebooks, three-ring binders, pencils, crayons, and backpacks that their children need to be ready to learn. How do these school lists happen? Together with WeAreTeachers.com, we gathered research from…